Profit & loss
Profit and loss reporting that ends the guesswork
Tired of feeling like you are flying blind, making crucial decisions on gut feeling instead of hard facts? Your application is already handling the data. The profit and loss report is what turns it into a clear picture of your financial health.
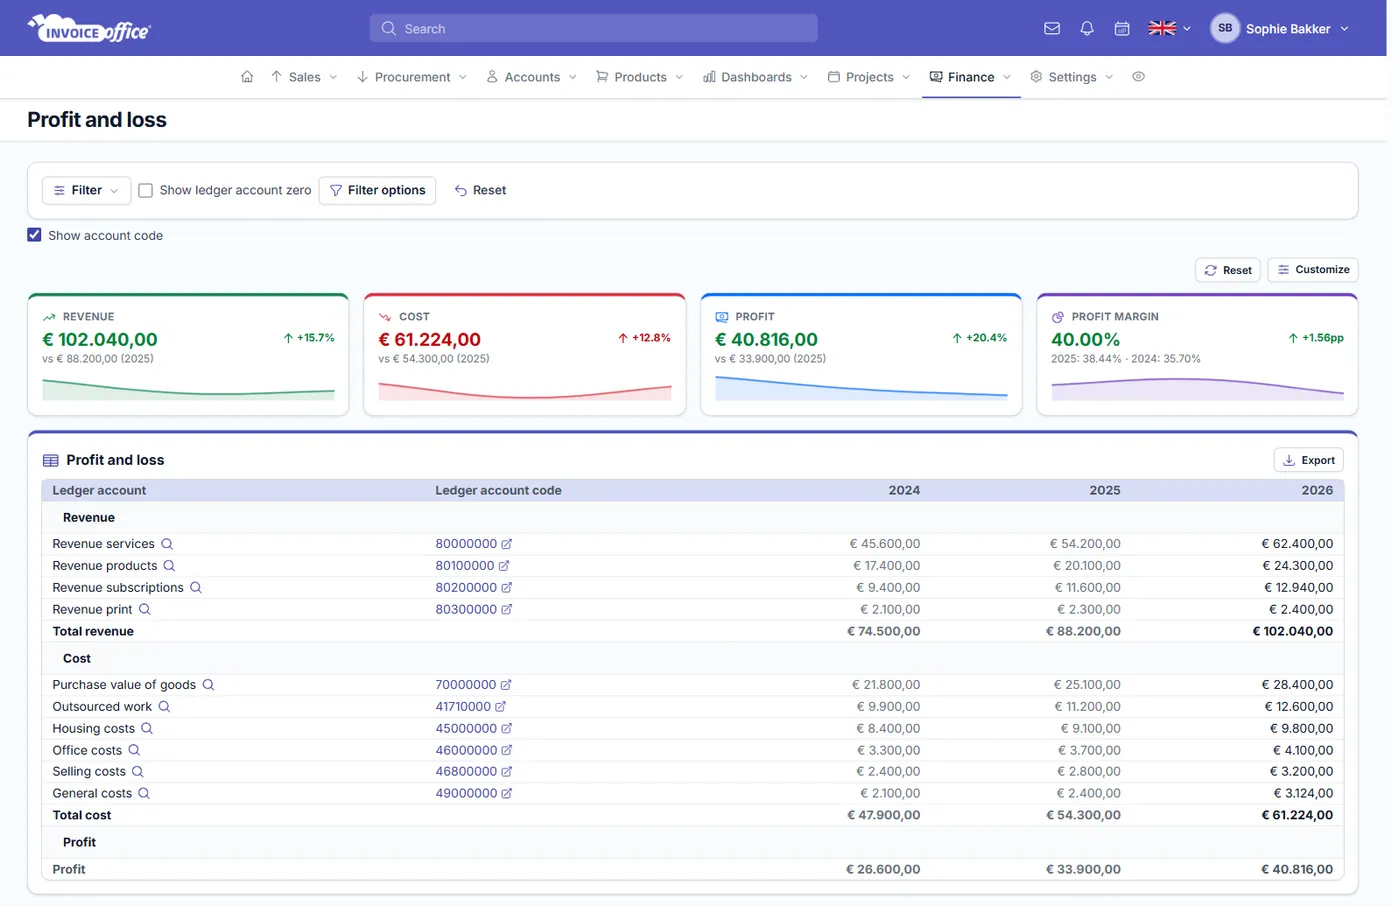
Everything in the report
Stop guessing, start knowing
A profit and loss report is only useful if you can question it. Filter it, break it down by category, drill into any total, and take it away in the format you need.
- Revenue, cost, profit and margin
- Four figures sit at the top of the report and answer the question you opened it for: what came in, what went out, what is left, and what percentage of revenue that leaves you.
- Measured against last year
- Each figure is shown against the same stretch of last year, with the percentage change beside it — the same months and the same number of days, so the comparison is honest.
- Three years, side by side
- The statement puts this year and the two before it in adjacent columns, per ledger account, so a trend is something you can see down a row rather than reconstruct.
- Charts you can read or take away
- Revenue and cost breakdowns, revenue against cost, margin over time and a three-year trend. Expand any chart, flip it to a table, or take it as PNG or CSV.
- Drill to the ledger account
- Any total that looks surprising can be opened — through to the ledger account report, or into the journal entries that produced the figure. Nothing has to be taken on trust.
- Revenue per income category
- A section below the statement breaks revenue down by income category, so you can see which parts of what you sell are actually carrying the business.
Running the report
Shape it around the question you have
A profit and loss report is your business’s financial DNA — raw sales figures and scattered expenses turned into a clear account of a period. These are the controls that decide which period, and how much of it you want to look at.
Pick the period in one click
Current month, current quarter, last quarter, current year, last year, last 12 months, year to date — or an exact date range. The tiles, the charts and the statement all follow it.
Show only what you use
Customise turns each tile, chart and table on or off, so the report you open every Monday is the short one and the report you take to the bank is the full one.
Hide the empty accounts
Ledger accounts with nothing in them can be hidden, and account codes shown or left off, so the statement reads as a summary rather than a chart of accounts.
Export to PDF, Excel or CSV
PDF for your accountant, your bank or your board; Excel or CSV when the numbers need to go somewhere else and be worked on further.
How it works
From raw data to strategic insight
Step 1Open the report
Go to Finance, then Reports, then Profit & loss. Everything it needs is already there from the invoices and purchases you have been recording.
Step 2Set the period
Filter on the month, quarter or year you care about. Revenue, cost, profit and margin come back measured against the same stretch of last year.
Step 3Drill in or export
Open any total for the ledger account report or the journal entries behind it, check revenue per income category, then export to PDF, Excel or CSV.
Profit and loss questions, answered
What is a profit and loss report?
Can I run it for a specific period?
Can I export the report?
How do I see what makes up a total?
Can I compare against last year?
Are there charts?
Can I see which parts of the business make the money?
Do I need to prepare anything first?
More answers in our FAQ and help center.
Related
What your numbers are built from
Stop settling for data — demand clarity
With our software we make the lives of entrepreneurs easier. Free to start, and 14 days free on every paid plan.