To see a profit and loss overview in Invoice Office, open the Profit and loss report under Finance. This P&L report shows your revenue, cost and profit for the period you choose, compares them with earlier years, and lists the amounts per ledger account. You can export it as Excel, CSV or PDF for your accountant.
This guide covers where to find the report, how to read it, how to change the period, and how to export it. For a month-by-month board of charts, use the finance dashboard.
Step 1 — Open the report
Go to Finance → Profit & loss. You can also open it from Dashboards → Finance → Profit & loss.
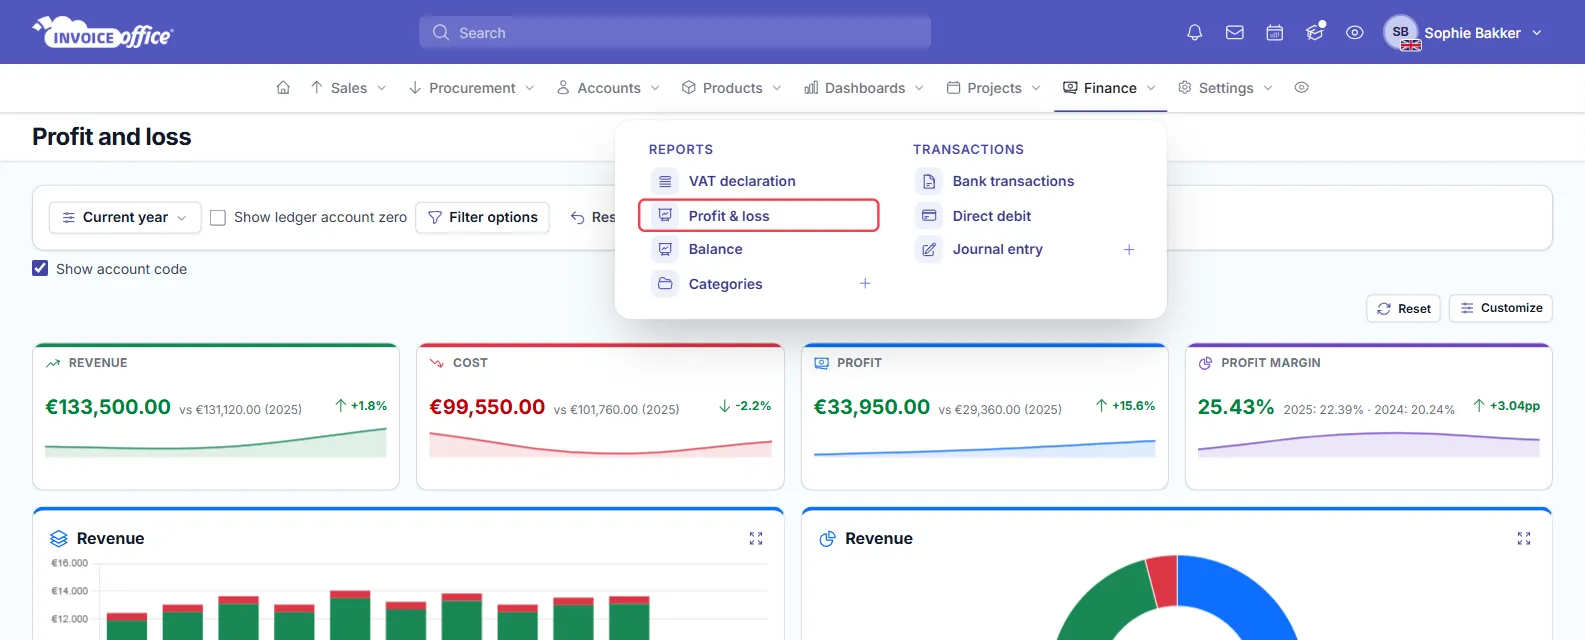
The report opens on the Current year. It needs the rights to view reports and finance, so ask the account owner if you can’t see it.
Step 2 — Read the four key figures
The tiles at the top give you a quick financial overview of the selected period:
- Revenue — what you earned.
- Cost — what you spent.
- Profit — revenue minus cost. When it is negative, the tile is called Loss.
- Profit margin — profit as a percentage of revenue.
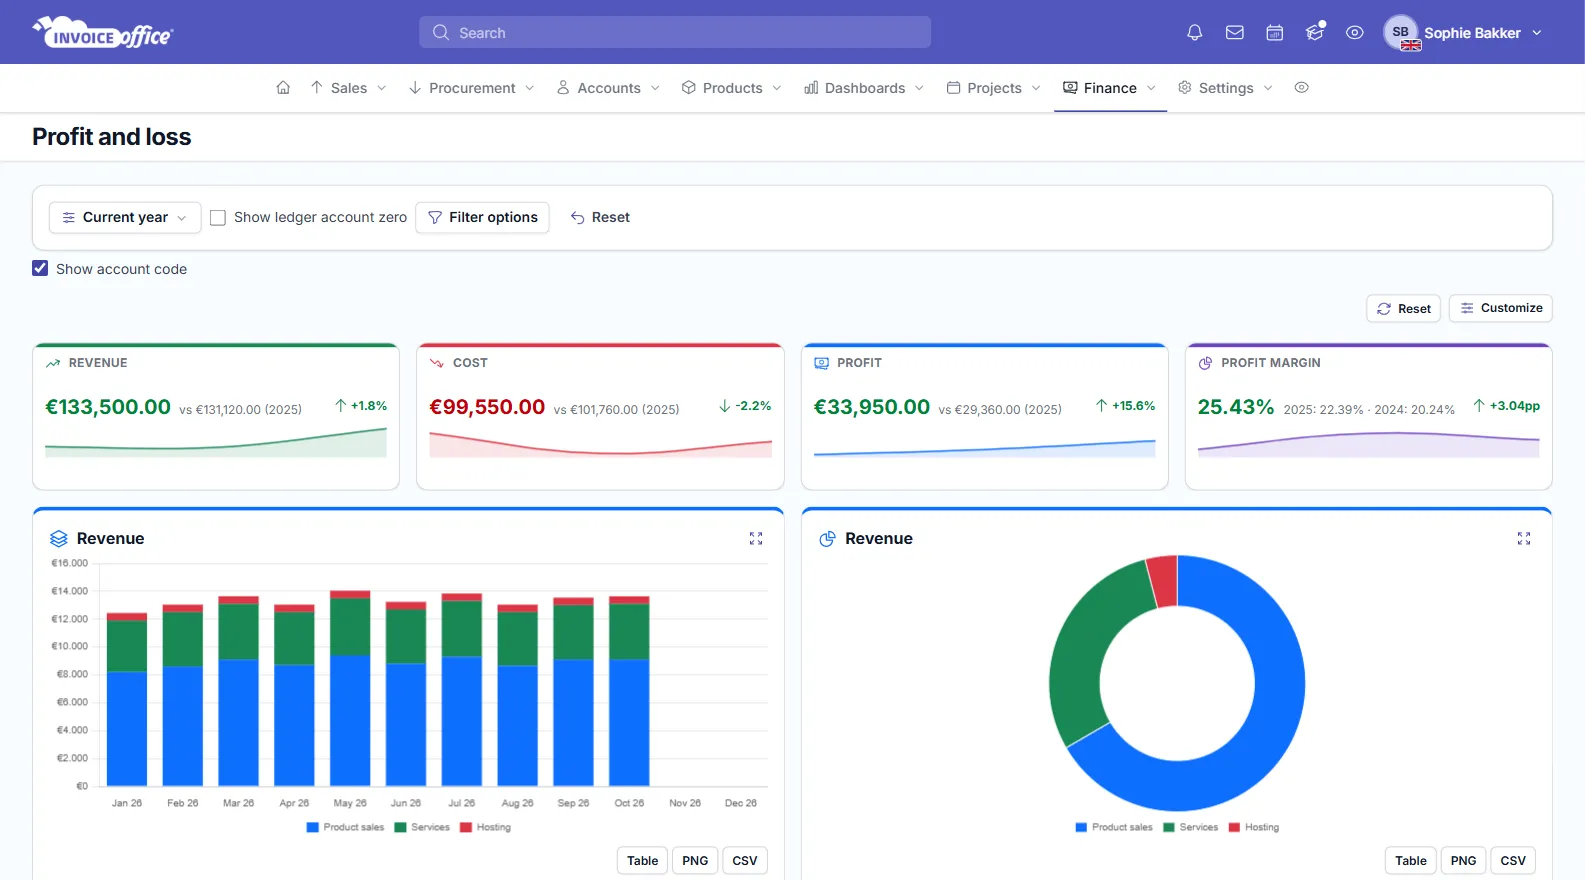
Each tile compares the figure with the same period last year, so the same months and days. Below the tiles, this revenue and cost report charts your revenue and cost per month and per ledger account, the profit margin, and a Three year trend. Use Table, PNG or CSV under a chart to see or download its figures. Customize lets you hide the tiles, charts and tables you don’t need.
Step 3 — Choose the period
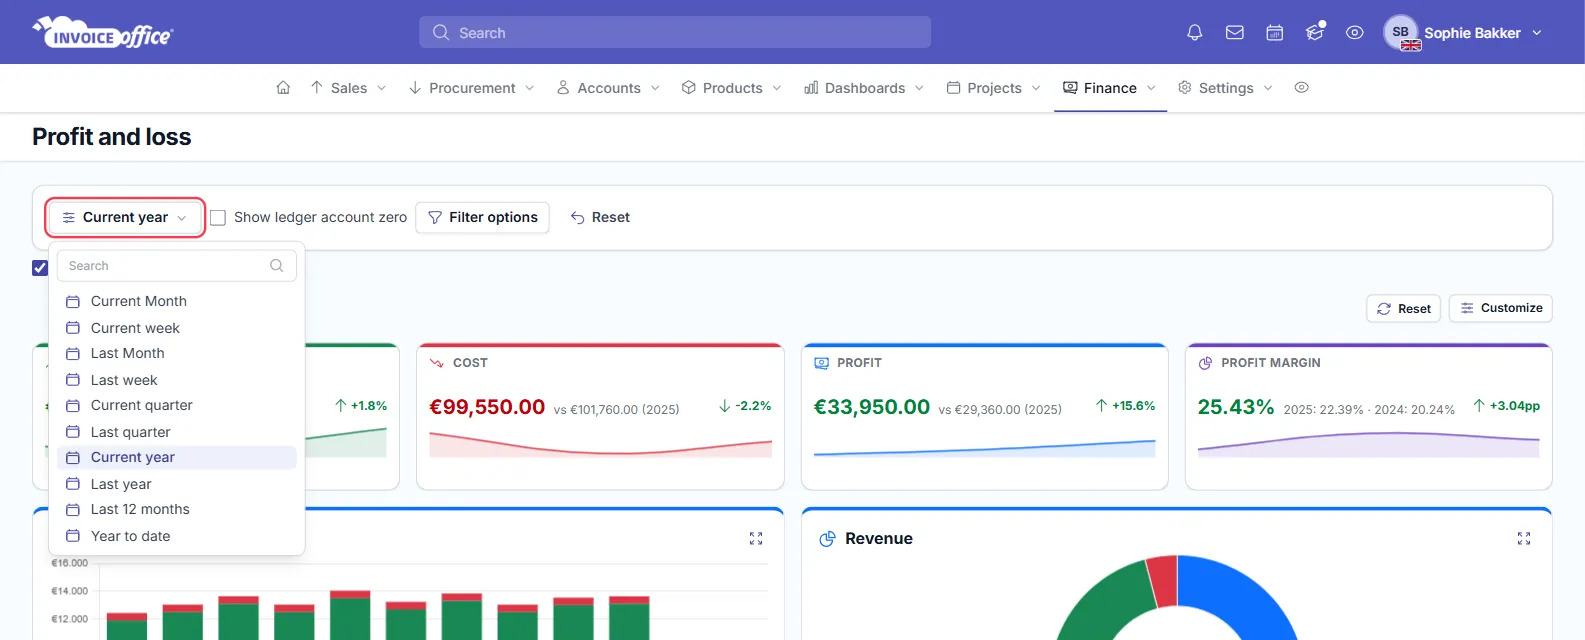
Click the period button, Current year by default, and choose a period such as Last quarter, Last year or Last 12 months. The tiles, charts and tables all follow it.
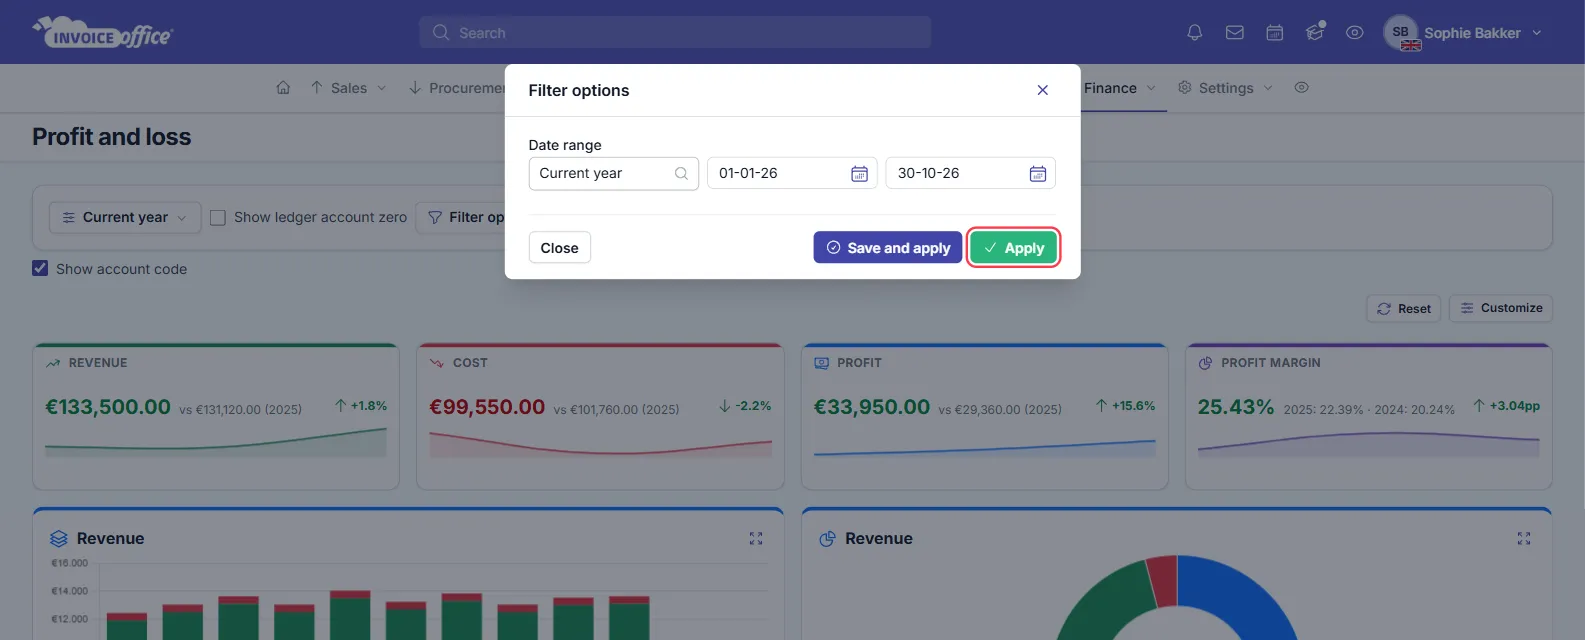
For exact dates:
- Click Filter options.
- Set the Date range.
- Click Apply. Save and apply saves it under a name in the period menu.
The period is the only filter. You can’t filter the report on one ledger account or a group of accounts, but the next step shows where to find them.
Step 4 — See the amounts per ledger account
The Profit and loss table lists your ledger accounts under Revenue and Cost, with a total for each and your Profit or Loss at the bottom.
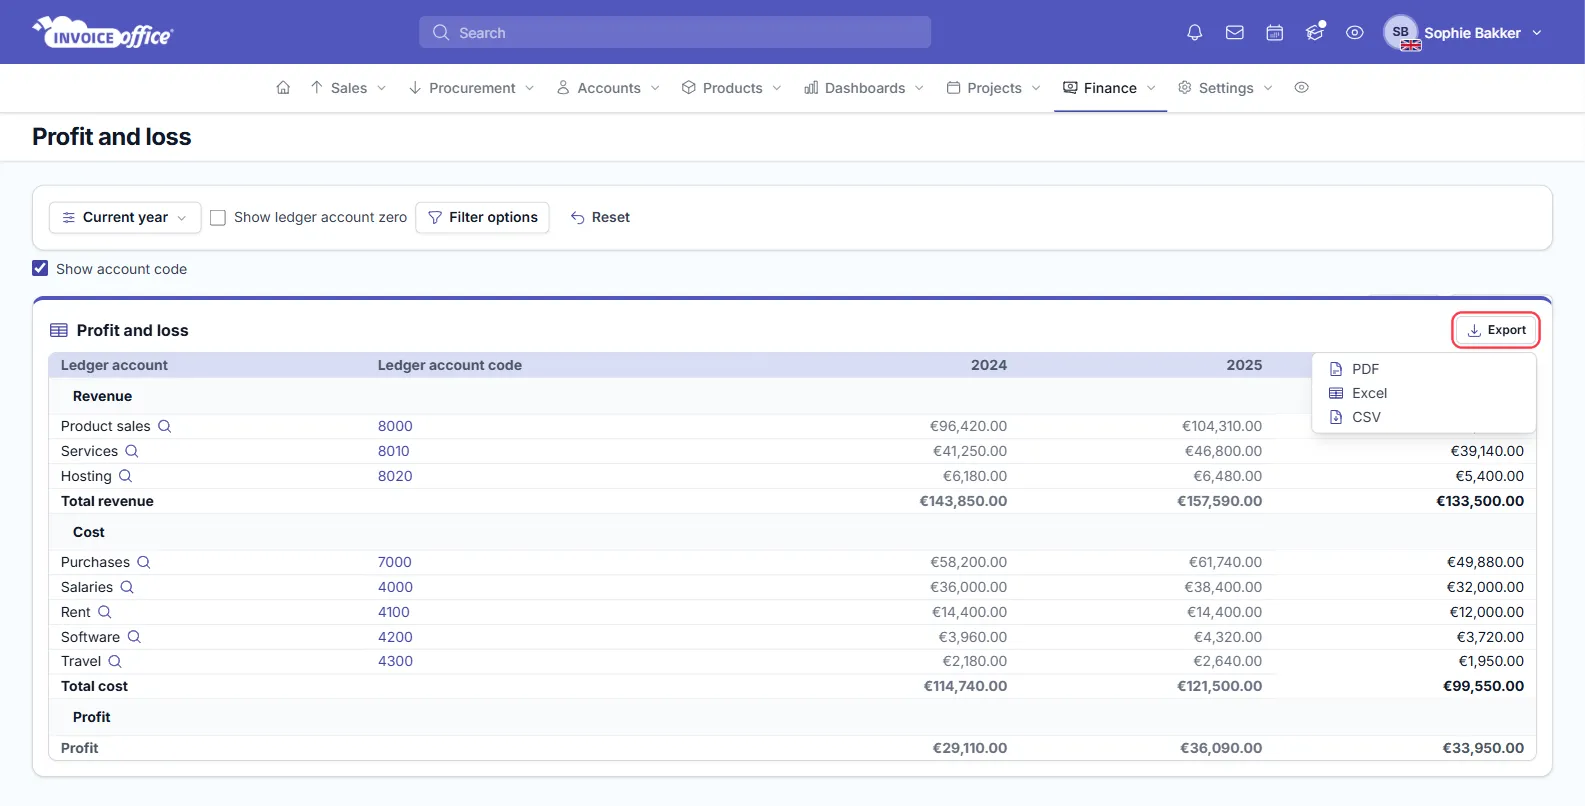
Compare the columns with care. The last column covers the period you selected. The two columns before it always show the full calendar year. So in October, your current year isn’t complete yet while last year’s column is.
The headings use the year your period starts in. With Last 12 months, the last column carries last year’s label, and the two earlier columns move back a year.
Two options above the table change what you see:
- Show ledger account zero also lists accounts without an amount. Tick it, then click Filter options → Apply.
- Show account code shows or hides the Ledger account code column.
To look closer at an account:
- Turn on Show account code, then click the code to open the ledger account report for that account.
- Click the magnifying glass beside the name to see the journal entries behind the amount.
Step 5 — See revenue per product category
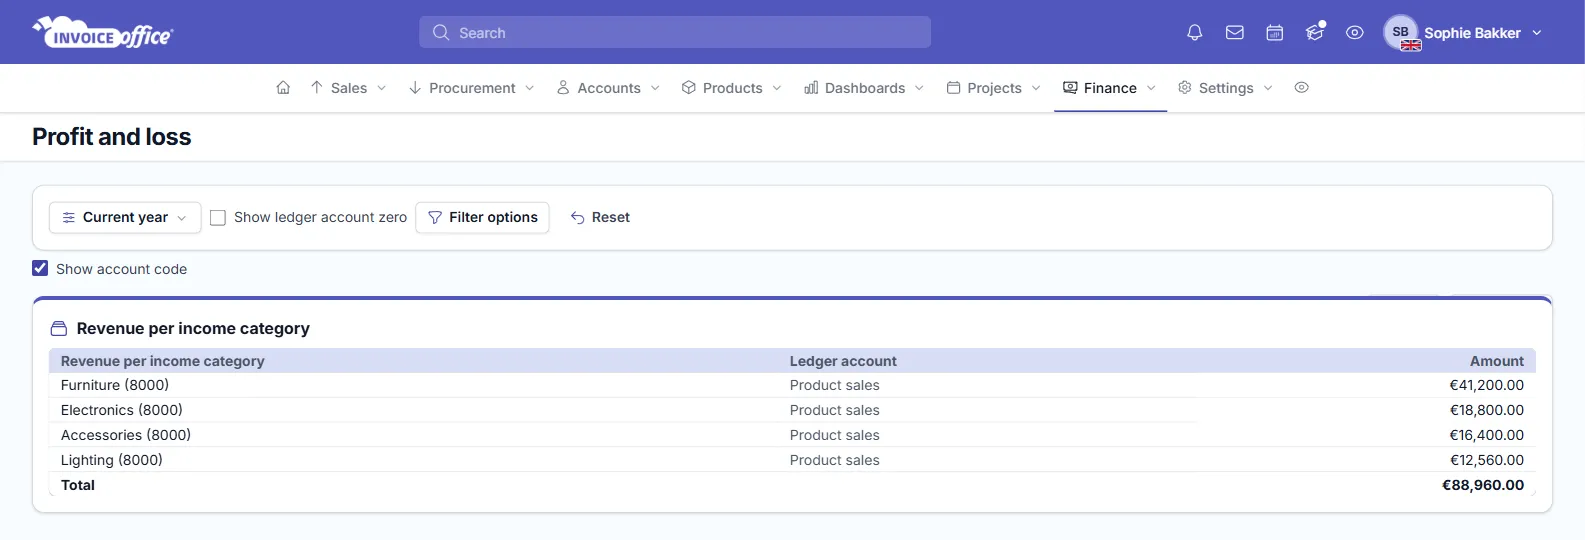
Further down, Revenue per income category breaks your revenue down by product category. It shows the categories that are linked to a ledger account with bookings in the period.
Step 6 — Export the P&L for your accountant
- Choose the period first. The export follows the period on your screen.
- In the Profit and loss table, click Export.
- Choose Excel, CSV or PDF.
Excel and CSV list each ledger account, its code and its amount for the selected period. The PDF also shows totals and the date range. No file includes the two earlier years, the tiles or the charts. To include accounts without an amount, apply Show ledger account zero first.
For the bookings behind these figures, see journals and ledger accounts. Any doubts? Contact us and we will help.