The quote funnel and pipeline overview in Invoice Office is the Quote Dashboard. It shows every stage of your sales pipeline — draft, open, in discussion, approved, lost and expired — with the number of quotes and their value at each stage, so you see at a glance what’s still in play and what you’ve won or lost. This article shows where to find it, how to read each stage and work out your conversion rate, and how to filter the pipeline by period and customer.
Where to find the quote pipeline
Go to Dashboards and, under Sales, choose Quotes.
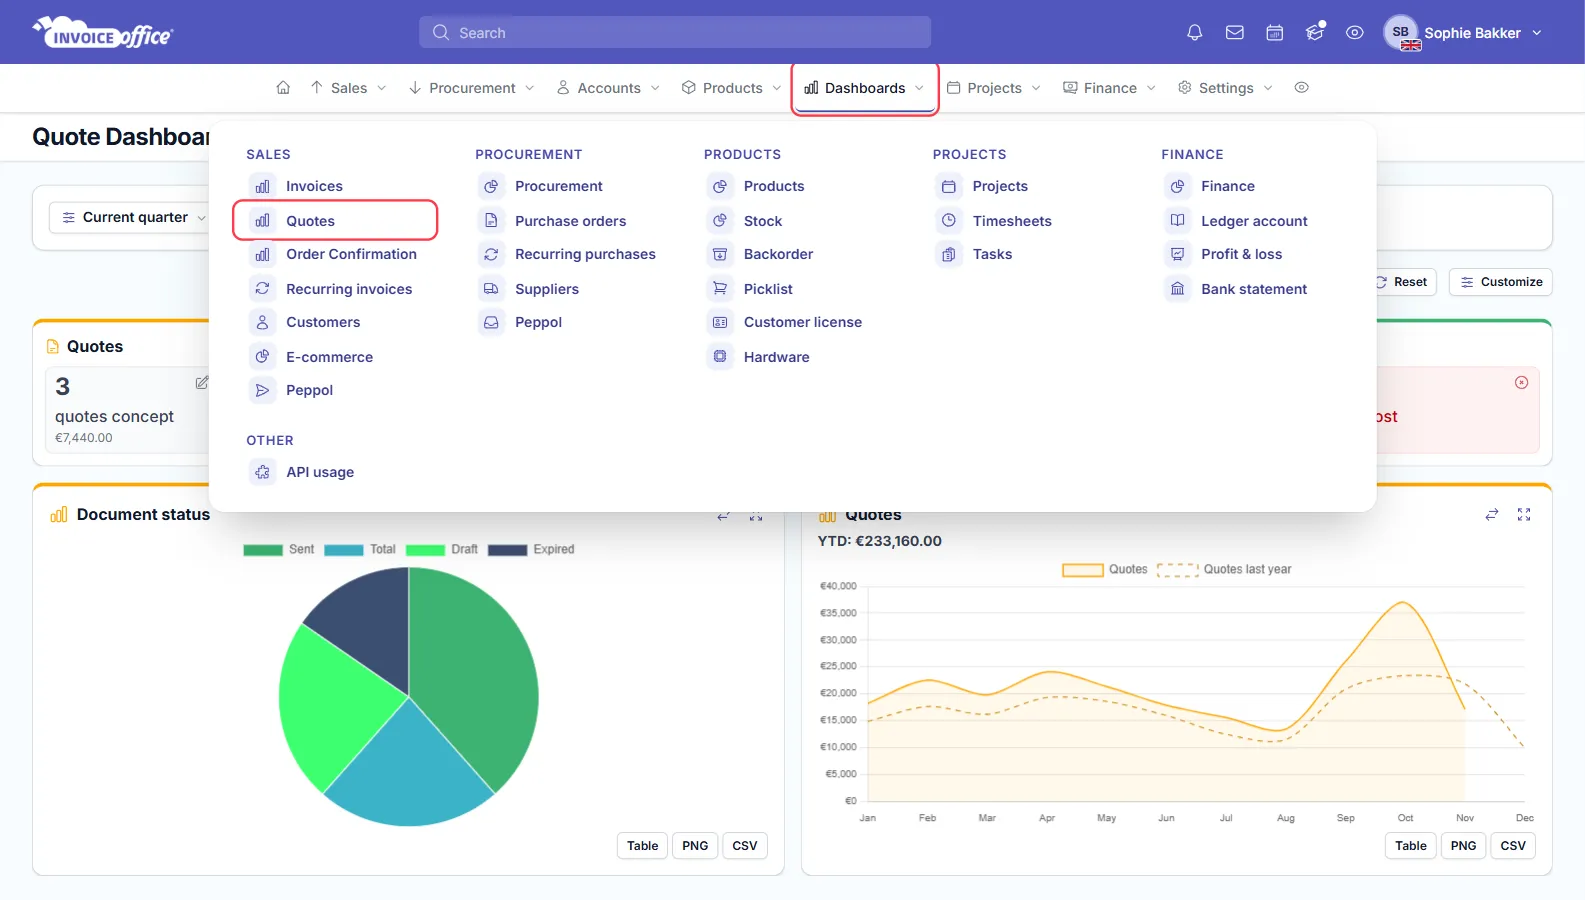
The Quote Dashboard opens on the current quarter. You need permission to view reports to open it; if you get a no-access message, ask an administrator to check your role — see how to manage user roles and permissions.
Read the pipeline: stages and values
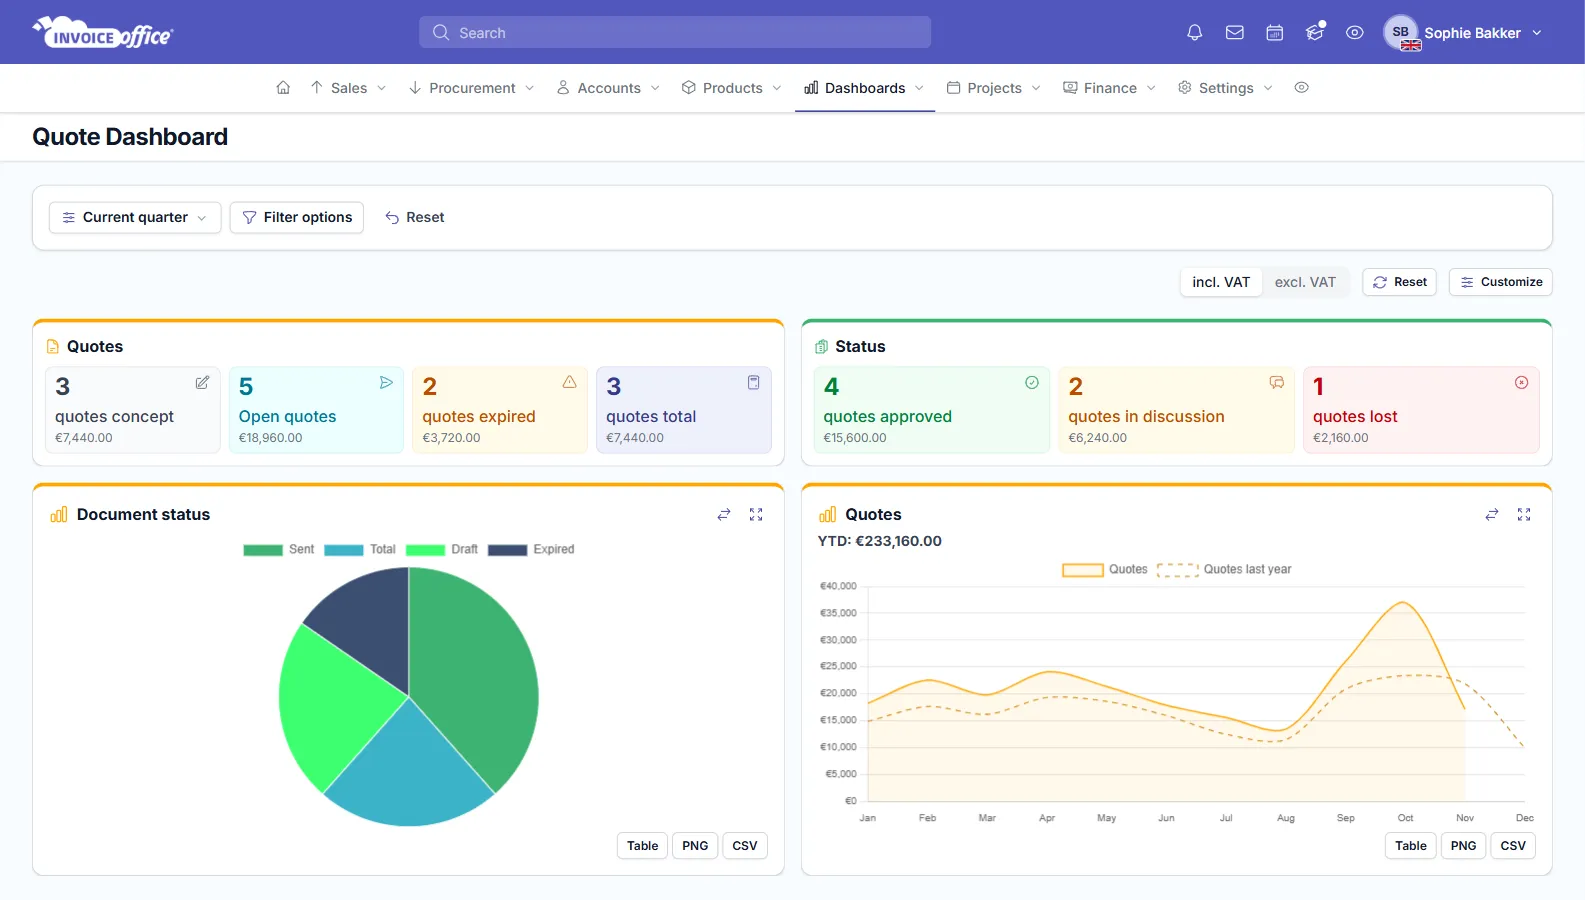
Each tile is a stage of the pipeline. The big number is how many quotes are in that stage, and the amount below it is their total value:
| Stage | Tile | Which quotes |
|---|---|---|
| Being prepared | quotes concept | Draft quotes you haven’t finalized yet. |
| Sent, awaiting an answer | Open quotes | Finalized quotes with the status Open. |
| In talks | quotes in discussion | Quotes you set to Discussion. |
| Won | quotes approved | Quotes with the status Agreed — approved online, invoiced or set by you. |
| Lost | quotes lost | Quotes you set to Not agreed. |
| Ran out | quotes expired | Open quotes whose expiry date passed without an answer. |
How a quote moves from one stage to the next is explained in how to track and manage quote statuses. A few things to know when you read the tiles:
- The period is the quote date. A quote counts in the period its date falls in, whatever its status is today.
- Amounts include VAT by default. Switch incl. VAT / excl. VAT above the cards to see the values without VAT; the choice is saved for you.
- quotes total currently shows the same figures as quotes concept, not the sum of all stages. For the full pipeline, add up the tiles.
- Negotiation and Partially Agreed have no tile of their own, so they aren’t in any of the figures.
Below the tiles are two charts:
- Document status — a pie chart of the number of quotes that are Sent (open), Draft and Expired in the selected period. Its Total slice repeats the draft count.
- Quotes — the value of all your quotes per month this year, against last year as a dashed line, with the year-to-date total as YTD. This chart always covers the whole calendar year, including VAT, whatever period, customer or VAT setting you pick.
Use Table, PNG or CSV under a chart to see its figures as a table or download them.
Work out your conversion rate
The dashboard doesn’t calculate a conversion rate, but the tiles give you everything you need. For the period you selected:
- Win rate by number = quotes approved ÷ (quotes approved + quotes lost + quotes expired). In the example above that is 4 ÷ (4 + 1 + 2) = 57%.
- Win rate by value = the approved amount ÷ the approved, lost and expired amounts together: €15,600.00 ÷ €21,480.00 = 73%.
- Value still in play = Open quotes + quotes in discussion: €18,960.00 + €6,240.00 = €25,200.00.
Leave drafts out of the calculation: they haven’t reached the customer yet. Compare the same period each time — for example, quarter by quarter — to see whether your conversion improves.
Filter the pipeline by period and customer
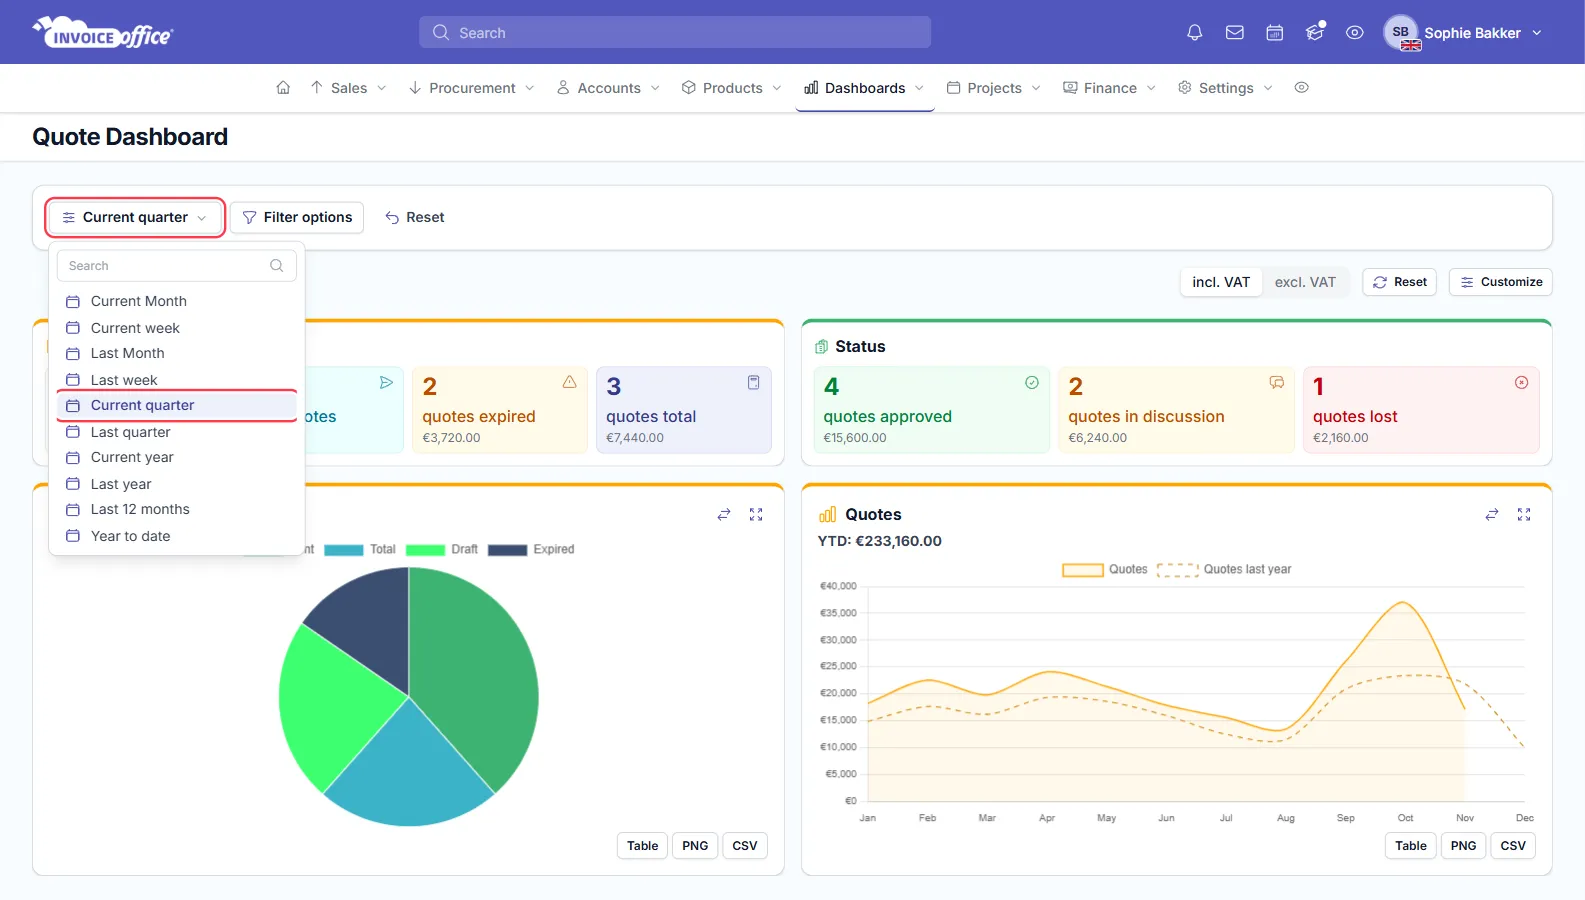
Pick a period. Open the period menu at the top left — it shows the current choice, such as Current quarter — and choose Current Month, Current week, Last Month, Last week, Current quarter, Last quarter, Current year, Last year, Last 12 months or Year to date.
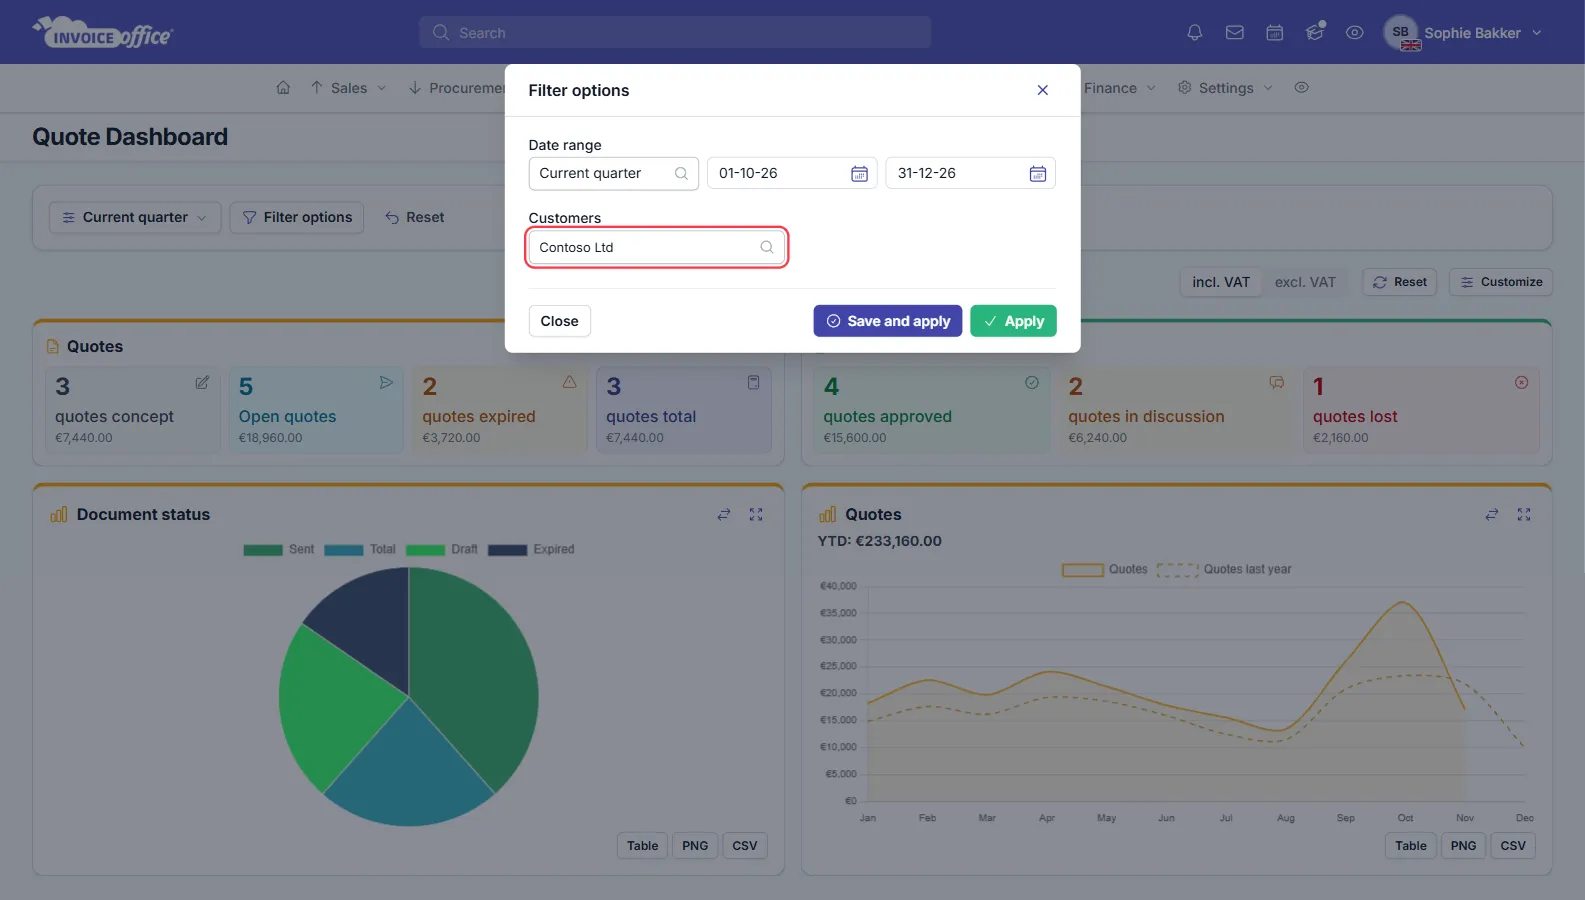
Filter on dates or a customer. Click Filter options:
- Under Date range, pick a period or enter a start and end date.
- Under Customers, search for a customer to see only their quotes.
- Click Apply. Save and apply also keeps this filter in the period menu, so you can pick it again next time.
Reset next to Filter options goes back to the current quarter for all customers.
There is no filter for the user who created or owns a quote: the Quote Dashboard always shows the quotes of your whole company.
Open the quotes behind a stage
Click any tile to open the list of quotes in that stage, for the same period and customer. Clicking Open quotes, for example, lists the quotes that are waiting for an answer, each with its Approval Status, value and due date.
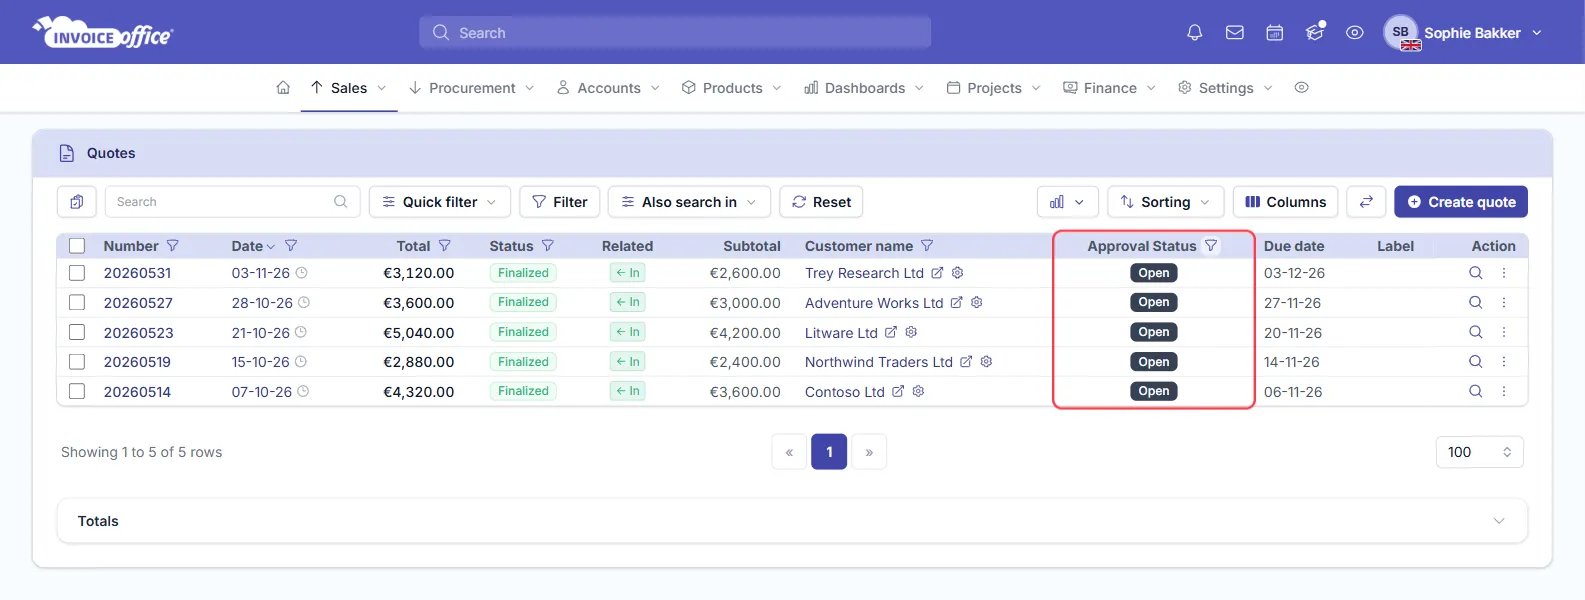
From there you can follow up: change a quote’s status from its ⋮ (Action) menu, or convert an agreed quote to an invoice. To catch quotes before they expire, set an expiry date and a pre-expiry reminder.
Customize the dashboard
Click Customize to show or hide the tile groups and charts, and drag or resize the cards. Reset next to Customize puts the default layout back. See how to customize dashboards.